在ipython notebook中调用ggplot的三种不同的方法
在大数据时代,数据可视化是一个非常热门的话题。各个BI的厂商无不在数据可视化领域里投入大量的精力。Tableau凭借其强大的数据可视化的功能成为硅谷炙手可热的上市公司。Tableau的数据可视化的产品,其理论基础其实是《The Grammar of Graphic》,该书提出了对信息可视化的图表的语法抽象体系,数据的探索和分析可以由图像的语法来驱动,而非有固定的图表类型来驱动,使得数据的探索过程变得友好而有趣。
然而对于The Grammar of Graphic的理论的实践,并非Tableau独占,ggplot作为R语言上得一个图形库,其理论基础也是这本书。(注,笔者曾就职的BI巨头,主要职责也是数据可视化,我们曾经和加拿大团队研发过类似的产品,基于HTML5和D3,可惜未能推向市场)
现在越来越多的人开始使用python来做数据分析,IPython Notebook尤其令人喜爱,它的实时交互把脚本语言的优势发挥到极致。那么怎样才能在IPython Notebook中使用ggplot呢?我这里跟大家分享三种不同的方式供大家选择。
RPy2
第一种方式是使用rpy2, rpy2是对rpy的改写和重新设计,旨在提供Python用户在python中使用R的API。
rpy2提供了对R语言的对象和方法的基本封装,当然也包括可视化的图库这一块。
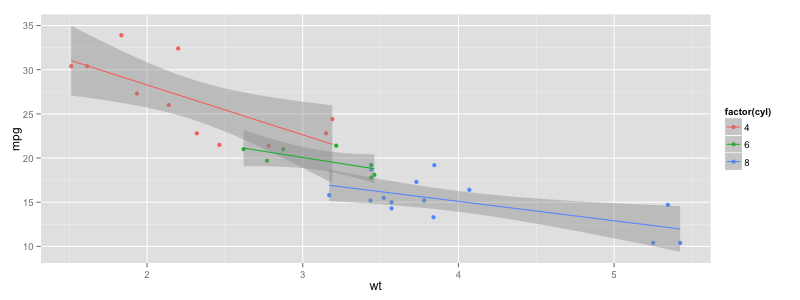
下面就是一段运行ggplot的R程序使用rpy2在python中运行的例子:
from rpy2 import robjects
from rpy2.robjects import Formula, Environment
from rpy2.robjects.vectors import IntVector, FloatVector
from rpy2.robjects.lib import grid
from rpy2.robjects.packages import importr, data
import rpy2.robjects.lib.ggplot2 as ggplot2

# The R 'print' function
rprint = robjects.globalenv.get("print")
stats = importr('stats')
grdevices = importr('grDevices')
base = importr('base')
datasets = importr('datasets')

mtcars = data(datasets).fetch('mtcars')['mtcars']

pp = ggplot2.ggplot(mtcars) + \
     ggplot2.aes_string(x='wt', y='mpg', col='factor(cyl)') + \
     ggplot2.geom_point() + \
     ggplot2.geom_smooth(ggplot2.aes_string(group = 'cyl'),
                         method = 'lm')
pp.plot()
以上程序在IPython Notebook中运行会有缺陷,会弹出一个新的窗口显示图,而且该python进程会阻塞在那里。我们希望图表能内嵌在IPython Notebook的页面中,为了解决该问题,我们引入如下代码:
%matplotlib inline
import uuid
from rpy2.robjects.packages import importr
from IPython.core.display import Image

grdevices = importr('grDevices')
def ggplot_notebook(gg, width = 800, height = 600):
    fn = '{uuid}.png'.format(uuid = uuid.uuid4())
    grdevices.png(fn, width = width, height = height)
    gg.plot()
    grdevices.dev_off()
    return Image(filename=fn)
运行上述代码后,我们把ggplot的调用pp.plot()改为调用ggplot_notebook(pp, height=300)就能成功嵌入显示ggplot的结果。
RMagic
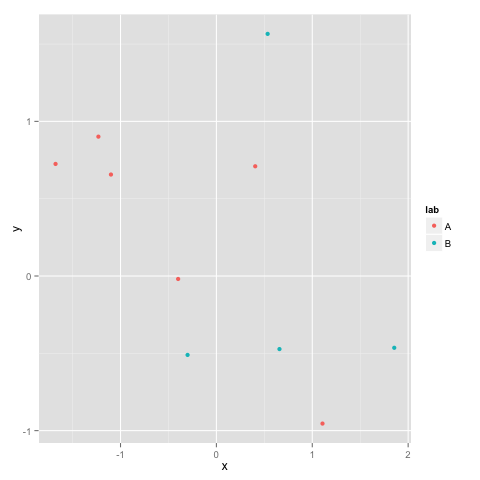
另一种方式是使用rmagic,rmagicy实际上依赖于rpy2。它的使用方式更像是直接在使用R
%load_ext rmagic
library(ggplot2)
dat <- data.frame(x = rnorm(10), y = rnorm(10),
                  lab = sample(c('A', 'B'), 10, replace = TRUE))
x <- ggplot(dat, aes(x = x, y = y, color = lab)) + geom_point()
print(x)
运行结果如下
ggplot for python
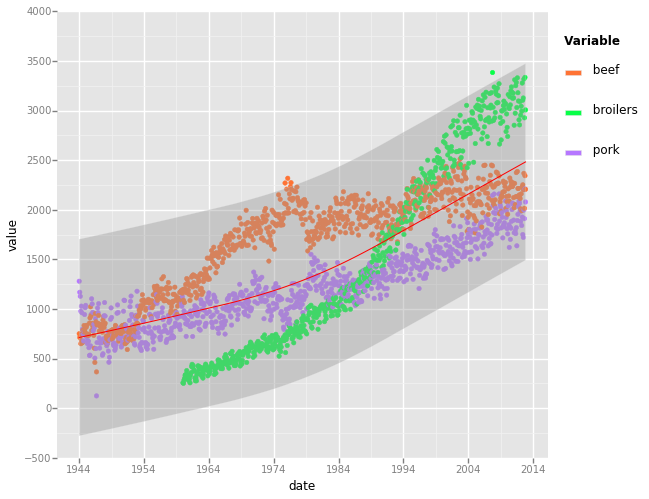
ggplot是一个python的库,基本上是对R语言ggplot的功能移植到Python上。
运行安装脚本
pip install ggplot
安装成功后,可以试一下这个例子
%matplotlib inline
import pandas as pd
from ggplot import *
meat_lng = pd.melt(meat[['date', 'beef', 'pork', 'broilers']], id_vars='date')
ggplot(aes(x='date', y='value', colour='variable'), data=meat_lng) + \
    geom_point() + \
    stat_smooth(color='red')
结果如下:
总结
本文提供了三种不同的方式在Python(IPython Notebook)中调用ggplot。
rpy2和Rmagic都是一种对R的桥接,所以都需要安装R。不同之处在于rpy2提供Python接口而Rmagic更接近R。
ggplot Python库是ggplot的Python移植,所以无需安装R,部署起来更为简单,但功能上也许和R的ggplot还有差距。
大家可以根据自己的需要做出选择。
2021年8月29日 05:40
I've proper selected to build a blog, which I hold been deficient to do for a during. Acknowledges for this inform, it's really serviceable!
2021年9月24日 10:30
I just thought it may be an idea to post incase anyone else was having problems researching but I am a little unsure if I am allowed to put names and addresses on here.
2022年9月10日 07:24
General Knowlorge is most important subject to all Class 10 students studying in English Medium, AP SSC Gk ModelPaper Telugu Medium & Urdu Medium of the State Board. So every student who is studying in the state Government & Private Schools can download the AP 10th GK Model Paper 2023 Pdf with answer solutions designed and suggested by subject experts. General Knowlorge is most important subject to all Class 10 students studying in English Medium.
2023年1月18日 23:45
This article provides a great overview of three different ways to call ggplot in an iPython notebook. From using the function ggplot() to the more specialized geom_ functions, this CBD Syrup article provides a comprehensive guide for plotting data with ggplot. It is especially helpful for those new to coding, as it breaks down the different components of each method and gives easy-to-follow instructions. A great resource for anyone wanting to get started with data visualization!
2024年1月13日 03:30
Actually I read it yesterday but I had some thoughts about it and today I wanted to read it again because it is very well written