利用Splunk做应用程序的性能分析
在我们的开发过程中,经常会需要对我们开发的程序做性能分析,有很多性能分析的工具,很多语言都提供了不同的profiling工具,这些工具很有用,提供了程序运行的原始记录数据,通过对这些数据的分析,可以得到程序运行的性能状况,找到问题所在。然而,这样的工具手机的数据比较原始,往往还需要一些更进一步的分析,才能定位问题。
Splunk是一个可以运行在不同平台上的机器数据的实时运维平台,所谓机器数据,就是指机器产生的数据,其中一个常见的场景就是日志。对于广大程序员来说,分析日志是一个非常常见,而且繁琐的工作,而且很多时候,必须通过日志来对程序进行调试,例如多线程的情况。记得以前为了几百兆或者几G的日志进行分析,不得不写了logViewer来分析。现在有了Splunk,真的极大的简化了对日志分析的工作。(注Splunk免费版支持每天500M的日志数据,超过这个额度需要收费)
通过日志进行性能测试是非常常见的,传统的也是在要分析的代码处,注入性能日志,然后在程序运行后,对写入的性能数据进行分析。使用Splunk,方法是一样的,但是有以下明显的改进
-
Splunk提供大量友好的分析命令和图表,无需另行开发分析日志的程序
-
Splunk可以实时的对应用程序作分析,可以在程序的运行过程中,一边运行,一边分析
我下面举一个我碰到的例子。
我要分析的程序是一个从AWS CloudWatch收集数据的Python程序。收集数据使用的是AWS提供的Restful API (Boto),为了更高效的收集数据,程序使用多个线程来调用Restful API 的Query接口。我希望通过性能日志了解每一个请求大概的耗时,以决定使用多少个线程数和对应的采集间隔。
首先,需要写日志:
logger.log(logging.DEBUG, "PerfLog=QueryStart" )
## Query Code Goes Here
do_query_aws()
## Query Complete
logger.log(logging.DEBUG, "PerfLog=QueryEnd, Query Result)
注意使用Name=Value的形式可以帮助Splunk在搜索时,提取要分析的字段。
然后运行程序,程序运行以后会生成日志文件,把该日志文件导入到Splunk,开始分析。

点击Add Data按钮,然后跟随Splunk的指导,选择A file or directory of files. 导入你的日志文件,导入过程中,Splunk会要求给你的日志文件命名一个sourcetype,我用的是“cloud_watch_debug”
导入好以后就可以开始搜索了。
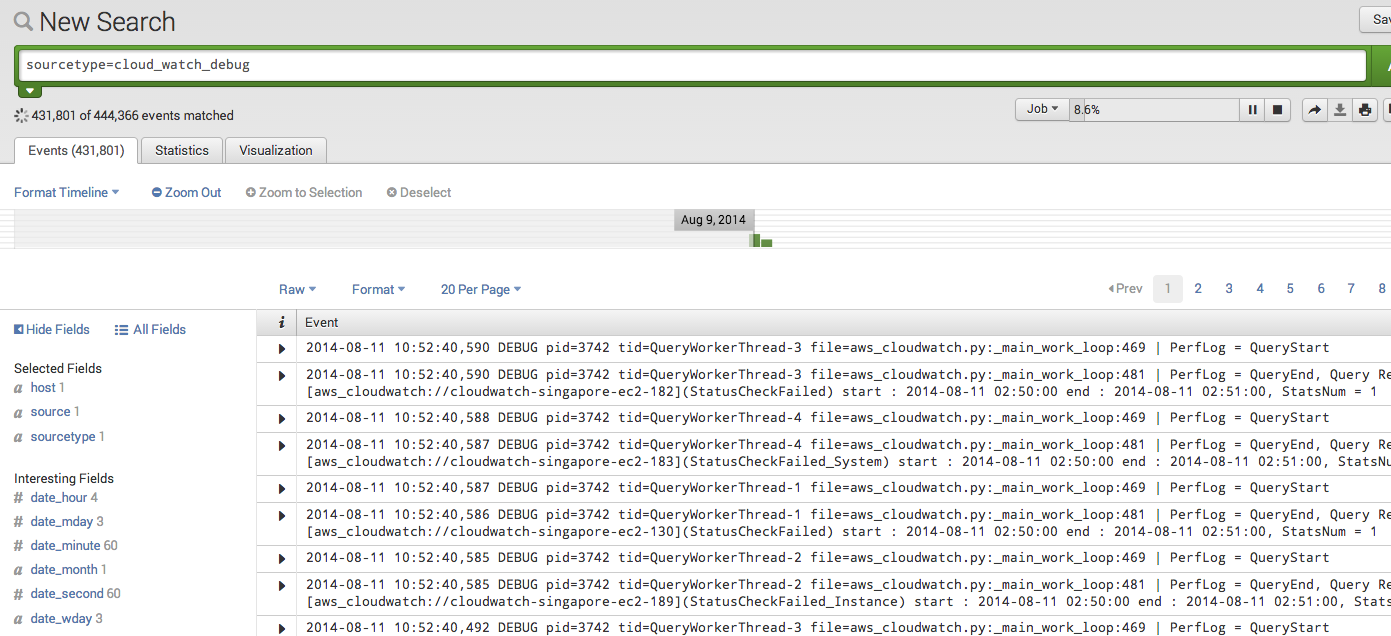
在搜索框中输入
sourcetype="cloud_watch_debug”
Splunk会实时的返回所有的日志文件,并按时间解析为一个个的事件。
Splunk的SPL(Splunk Search Language)是一个类似SQL和UNIX Command的综合体,可以对数据进行搜索,分析,统计,生成图表,支持管道,使用起来非常方便,建议大家通过官方文档来了解。
我么今天要做的是性能分析,那么我就是要统计一下,发了多少个query,每一个query用了多少时间。
每一条日志的内容大致如下
2014-08-11 10:52:40,587 DEBUG pid=3742 tid=QueryWorkerThread-1 file=aws_cloudwatch.py:_main_work_loop:469 | PerfLog = QueryStart
Splunk能够提取出大量的信息和字段(field),包括事件,pid,tid,file等等,还有我们在日志中加入的字段PerfLog。
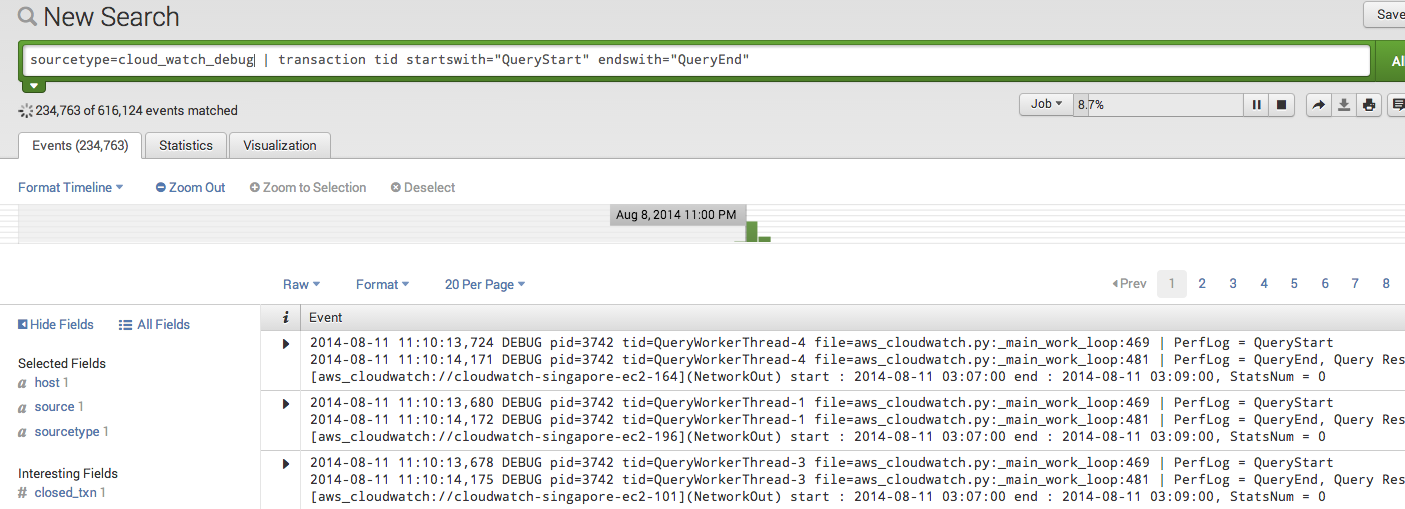
想要知道每一个查询所花费的时间,可以通过Splunk提供的transaction命令。
sourcetype=cloud_watch_debug | transaction tid startswith="QueryStart" endswith="QueryEnd"
-
tid表示每一个transaction需要有相同的tid,也就是说同一个线程
-
startwith和endwith表示transaction的其实和结束标志
该命令返回所有的query的transaction
然后我们就可以统计每一个transaction所用的时间
sourcetype=cloud_watch_debug |
transaction tid startswith="QueryStart" endswith="QueryEnd" |
stats sum(duration),count, avg(duration),max(duration),min(duration)
-
stats命令用于对数据进行统计
-
duration是Splunk对transaction生成的事件跨度
-
sum,count,avg,max,min是统计命令
运行结果如下:

程序一共发送了111075个cloudwatch的请求,最慢的需要2.5秒,最快的0.06秒,平均大概0.11秒。
我还想知道query的耗时随时间的变化,我可以生成一个timechart
sourcetype=cloud_watch_debug |
transaction tid startswith="QueryStart" endswith="QueryEnd" |
timechart avg(duration)
结果如下(最近1小时):
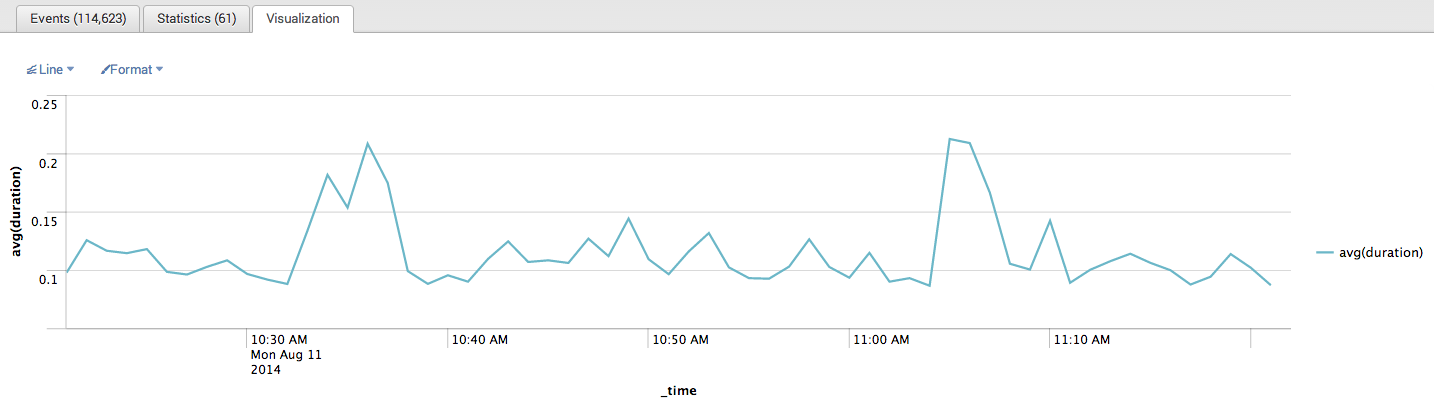
通过该分析在过去的一个小时里10:30和11:00之后的十分钟时间段,耗时略有上升,大概峰值0.2秒。
总结:
Splunk的日志分析功能非常强大,而且500M的免费版基本能够满足大部分程序员对程序日志的分析要求。有效地使用Splunk来进行日志分析,可以做到事半功倍,小伙伴们快来试用吧!
2021年8月29日 05:16
Great info! I recently came across your blog and have been reading along. I thought I would leave my first comment. I don’t know what to say except that I have.
2021年9月24日 10:26
I prefer merely excellent resources - you will see these people in:
2021年9月27日 21:29
In different business, essentially the most important things to consider is the volume of revenue it could possibly generate along with the time to get started generating the item. When people start in search of a small business, you might find that running your individual cleaning small business fits this bill properly. It is usually one business that could provide incredibly sound personal returns within a few months; and a small number of complications will likely be encountered though running this company.
2022年9月10日 06:41
Since the Government of AP also provided Computer labs for students in all Government schools also.Computer Knowledge is very much essential nowadays. Even Checking the Results of various examinations, AP 10th computer Model Paper Downloading hall tickets and study materials for multiple exams and booking tickets etc ..need minimum Technical Knowledge is much more important for everyone. Since the Government of AP also provided Computer labs for students in all Government schools also.
2023年1月14日 18:28
There are many performance analysis tools available, but Splunk is one of the most popular and most versatile. It can be used to monitor and troubleshoot a wide variety of applications, including cbd for cardiovascular disease web applications, transaction processing systems, and more. Splunk can be used to identify performance bottlenecks, diagnose errors, and track the impact of changes.